The analytics panel shows how you use the agent: how many prompts you sent, how much text (tokens) was spent, how much it cost, and how fast the model answered. Everything is drawn on clear charts that you can filter by any period — a day, a week, or all time. This helps you understand your spending and spot patterns — for example, which days you are most active.
What the analytics tracks
The data is collected automatically from your chat sessions — nothing to enable or configure, and counting starts from the very first message. The panel shows:
- Requests — the number of messages you sent;
- Messages — the total count of messages (both yours and the agent’s replies);
- Token usage — how much text was spent: sent to the model, generated in reply, plus cache writes and reads (the cache “remembers” text that was already processed — touching it again costs less);
- Costs — an estimate based on your AI provider’s prices;
- Response speed — how fast the model answers (in tokens per second);
- Commit activity — how many times changes were saved to Git through the interface;
- Per-model data — the same costs, tokens, and speed, broken down by each AI model.
How to open the analytics
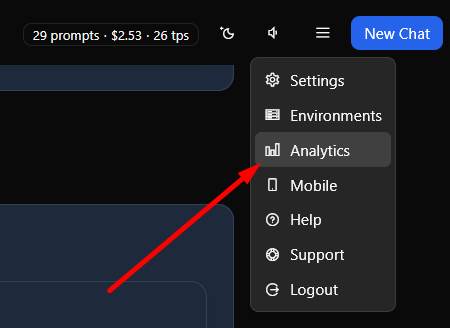
Pick Open Analytics from the menu in the header. The panel opens with a period selector at the top, key figure cards below, and detailed charts in collapsible sections.
Panel overview
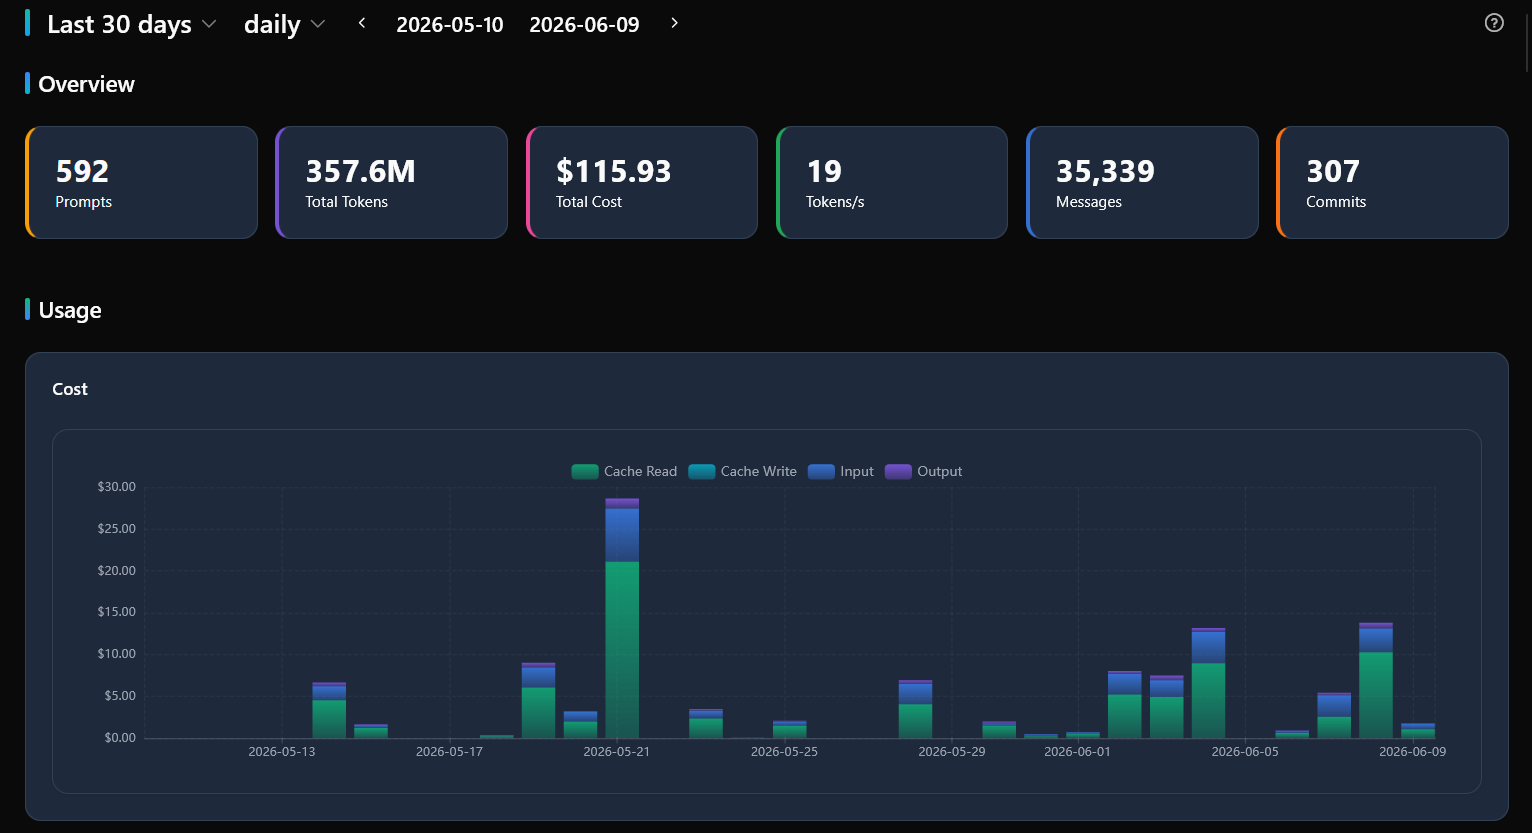
At the top are the key figure cards — the headline numbers for the selected period:

- Requests — how many messages you sent (plotted in the Prompts chart in the Cost section);
- Total Tokens — the total volume of text: input, output, and cached;
- Total Cost — estimated spending across all chats;
- Tokens/s — the average response speed of the AI;
- Messages — all messages exchanged;
- Commits — how many times changes were saved to Git.
The cards recalculate for the selected period — handy for comparing figures across different time spans.
Sections with charts
Below the cards come several sections with charts. Each section collapses — click its title to expand or collapse it. The open/closed state is remembered in your browser, so on your next visit the panel returns to its familiar shape.
Cost
The biggest section — charts of cost, prompts, and commits over time:
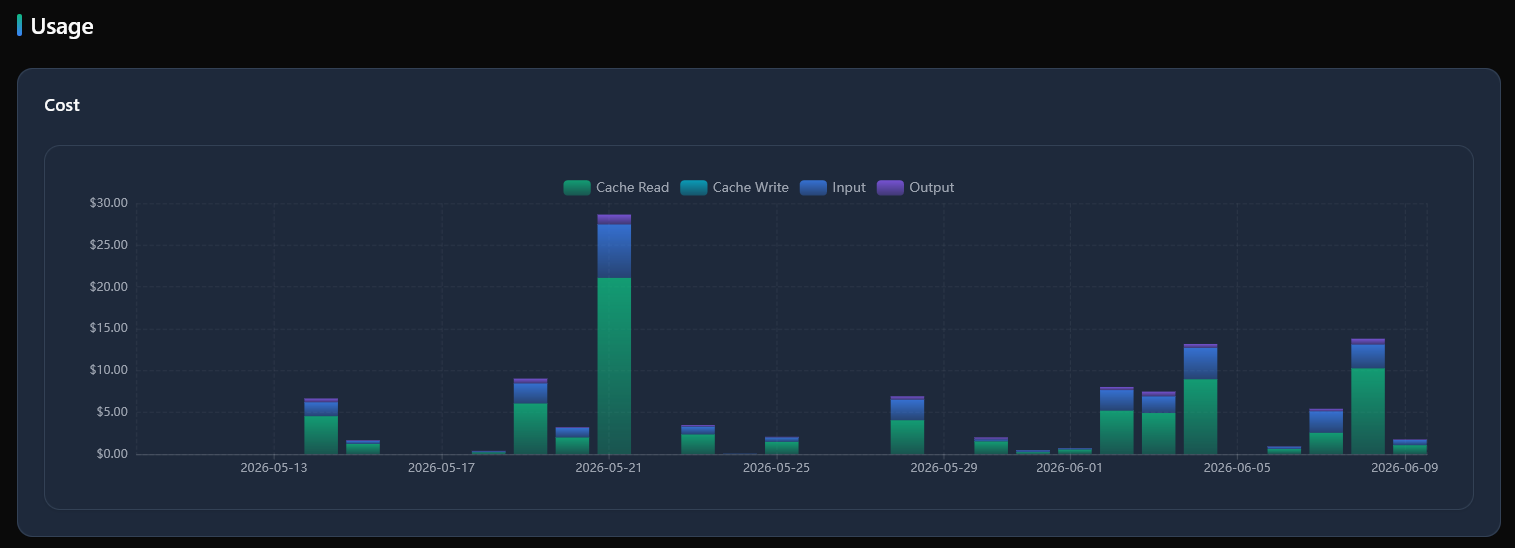
- Cost — spending over time with a breakdown: input text, output text, cache write and read;
- Model Cost — how spending is spread across AI models;
- Prompts — the number of prompts over time, plus the message and chat counts for the period;
- Commits — how often changes were saved over time.
Tokens
The Tokens section — charts of text volume and speed:
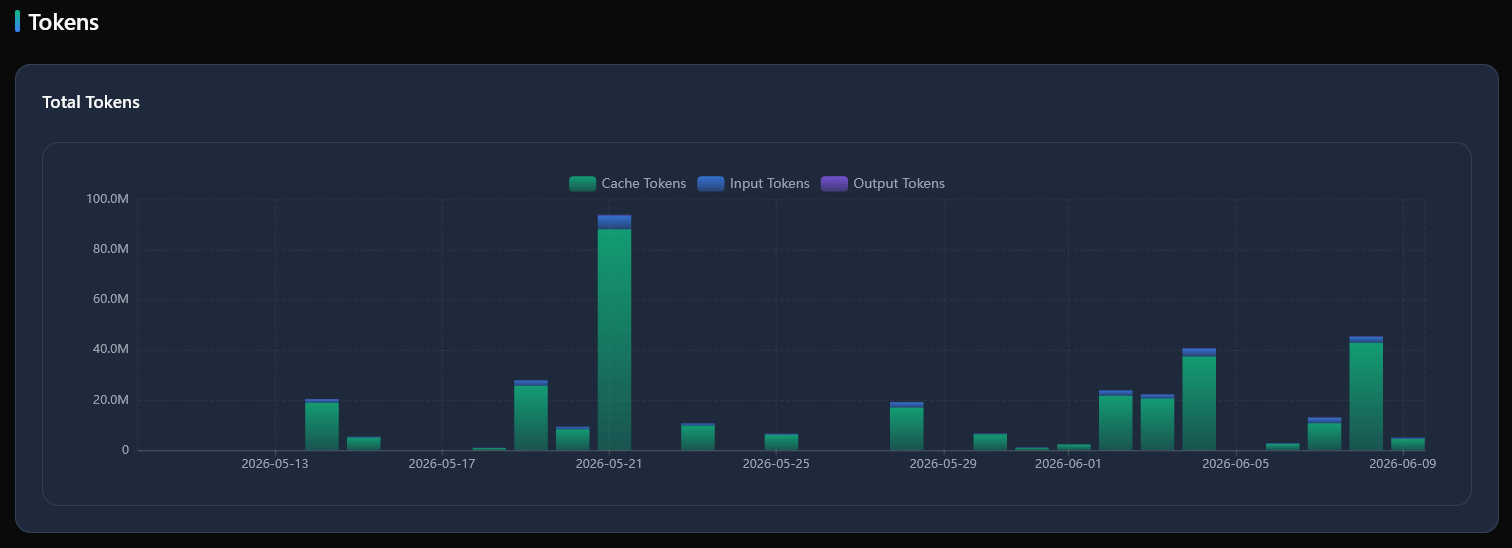
- Total Tokens — consumption over time, accumulating input, output, and cached tokens;
- Tokens per Second — the AI’s response speed over time;
- Model Tokens — consumption broken down by each model;
- Model Speed — a comparison of how fast different models answer.
Messages
A nested section inside Cost — charts of message counts and their intensity:
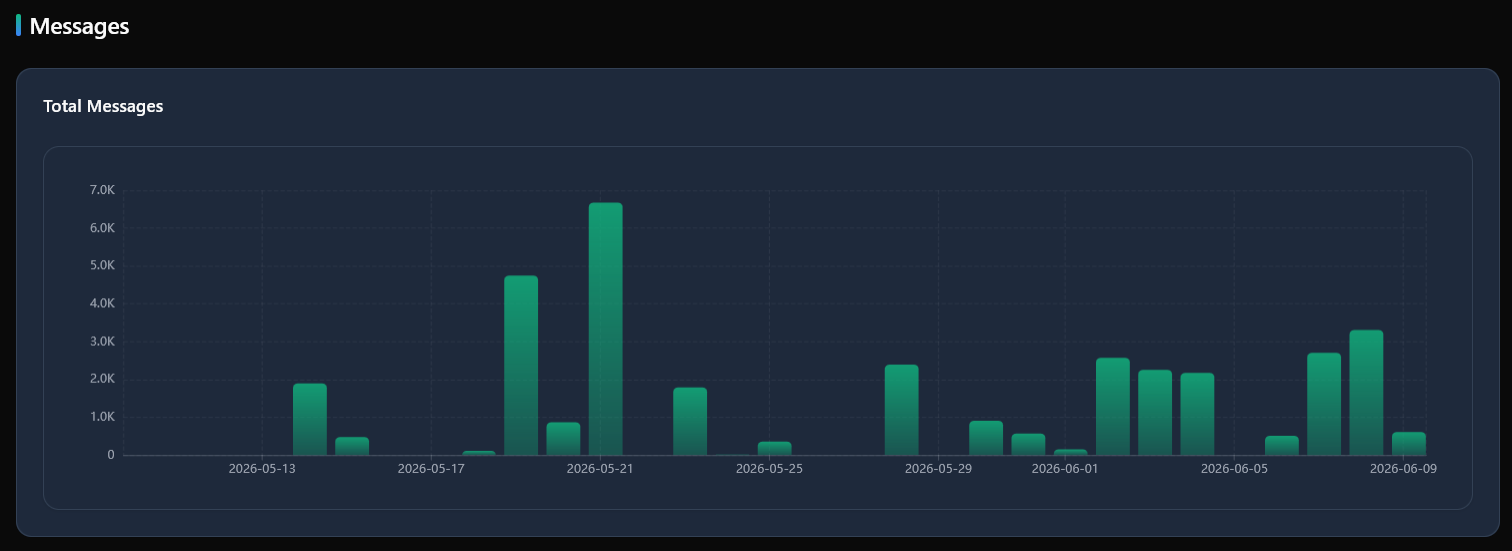
- Total Messages — the number of messages over time;
- Messages per Second — how intense the message exchange was over time.
Hour of Day
Here the data is grouped by hour of day (0–23) in your local time. It helps you see which hours you work with the agent the most:
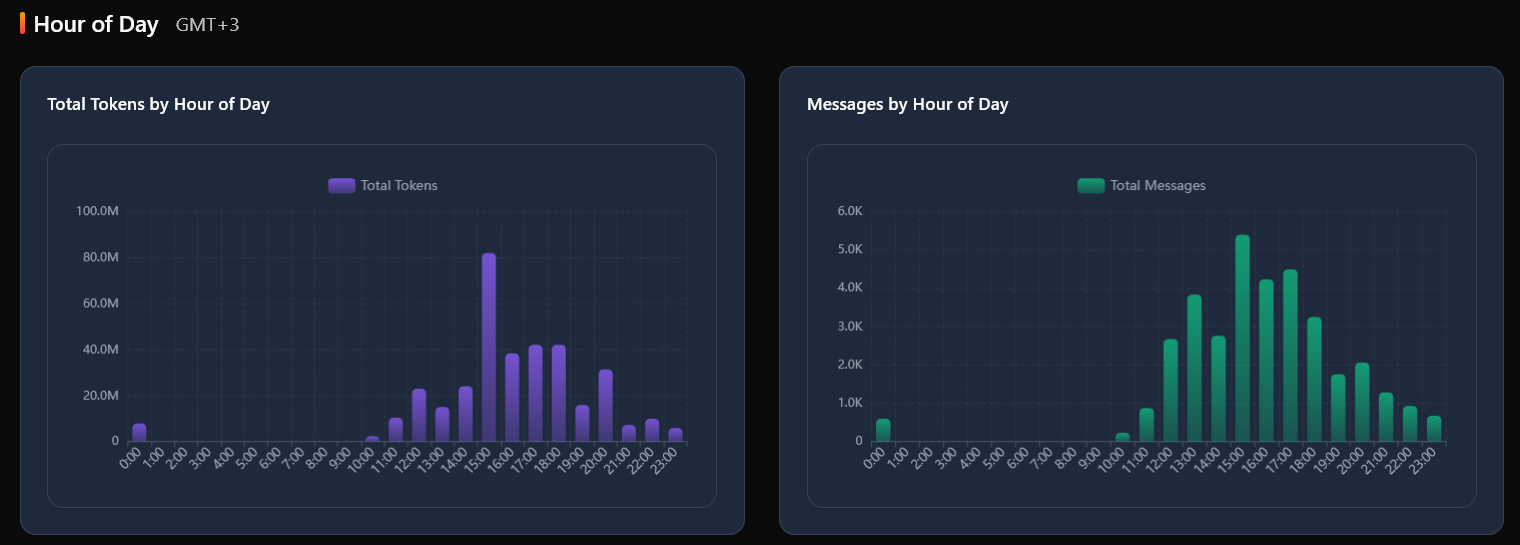
- Total Tokens by Hour of Day — the volume of text for each hour;
- Messages by Hour of Day — the number of messages for each hour;
- Tokens/s by Hour of Day — the average response speed by hour;
- Messages/s by Hour of Day — the average message intensity by hour.
Day of Week
The data is grouped by day of the week — you can see which days are your most active:
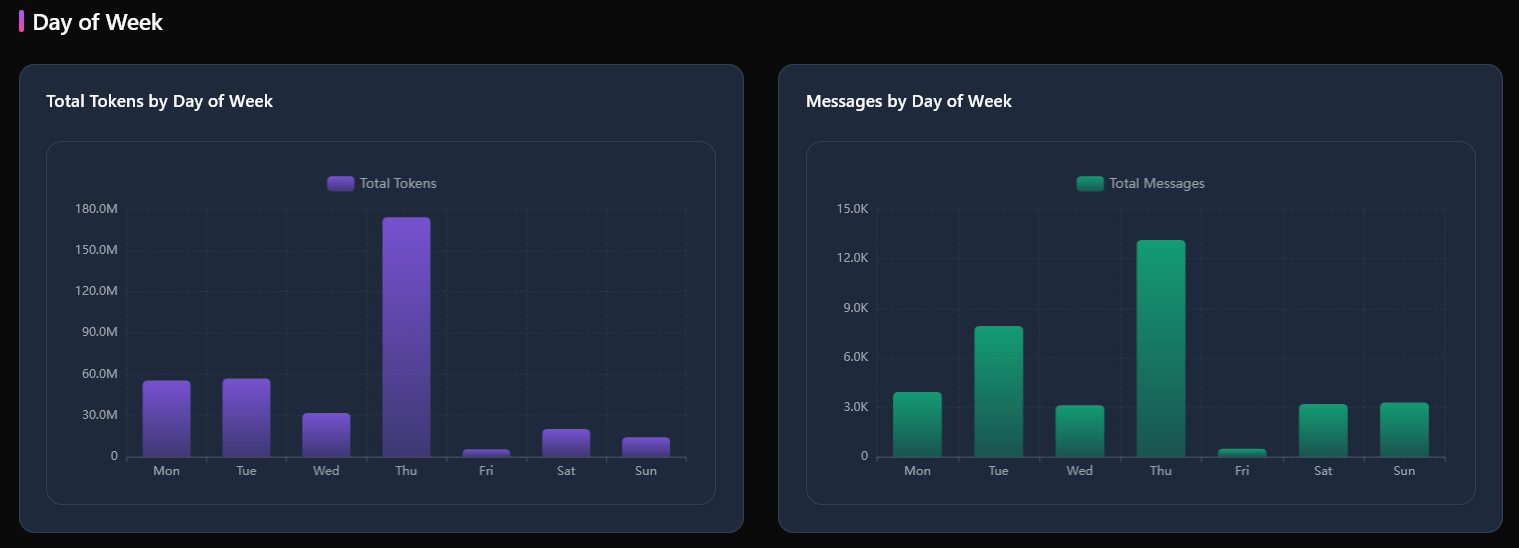
- Total Tokens by Day of Week — the volume of text for each day;
- Messages by Day of Week — the number of messages for each day;
- Tokens/s by Day of Week — the average response speed by day;
- Messages/s by Day of Week — the average message intensity by day.
Distributions
Charts of how the figures vary from chat to chat — for example, which conversations turn out the most expensive or the longest:
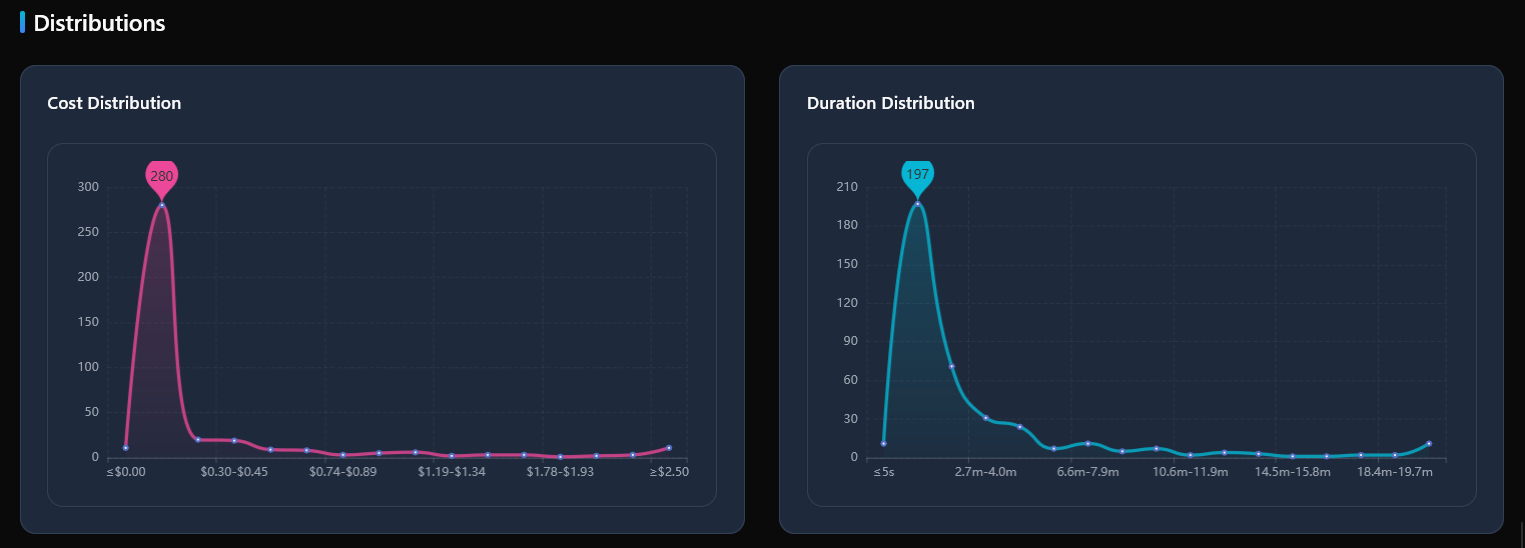
- Cost Distribution — how spending is distributed across chats;
- Duration Distribution — how long chats run on average (processing time);
- Tokens/s Distribution — the spread of response speeds across chats;
- Messages/s Distribution — the spread of message intensity across chats.
Skills
The Skills section shows how work is spread across skills — sets of instructions attached to chats. Every skill has its own color; chats without a skill are combined into a “No skill” series. Three stacked charts for the selected period:
- Tokens by skill — the volume of text for each skill;
- Cost by skill — spending by skill;
- Total chat time by skill — the total processing time of chats with that skill. This chart replaced the former “tokens per second by skill”; model speed is still visible in the Tokens and Distributions sections.
All charts are interactive: hover over a point to see exact values. The data refreshes itself when you change the period or the granularity.
Choosing the period
The period selector at the top of the panel filters all data by time:

- Ready-made periods — quick picks: Today, Yesterday, Last 7 days, 14 days, 30 days, 90 days, and more;
- Custom period — set exact start and end dates;
- All time — from your first chat to today.
All cards and charts recalculate for the selected period — handy for comparing weeks, months, and specific stretches.
Granularity
You can change the “zoom” of the data — points per hour, day, week, or month:
- Hourly — one point per hour; for ranges longer than 30 days it switches to daily automatically;
- Daily — one point per day; the default, best for ranges from a week to a month;
- Weekly — weekly totals; handy for ranges from a month to a quarter;
- Monthly — monthly totals; for spotting long-term trends.
The chosen granularity is remembered in your browser between visits.
The chats table
Below the charts sits a table with statistics for each chat. Clicking a row opens that chat; Ctrl+click opens it in a new tab.
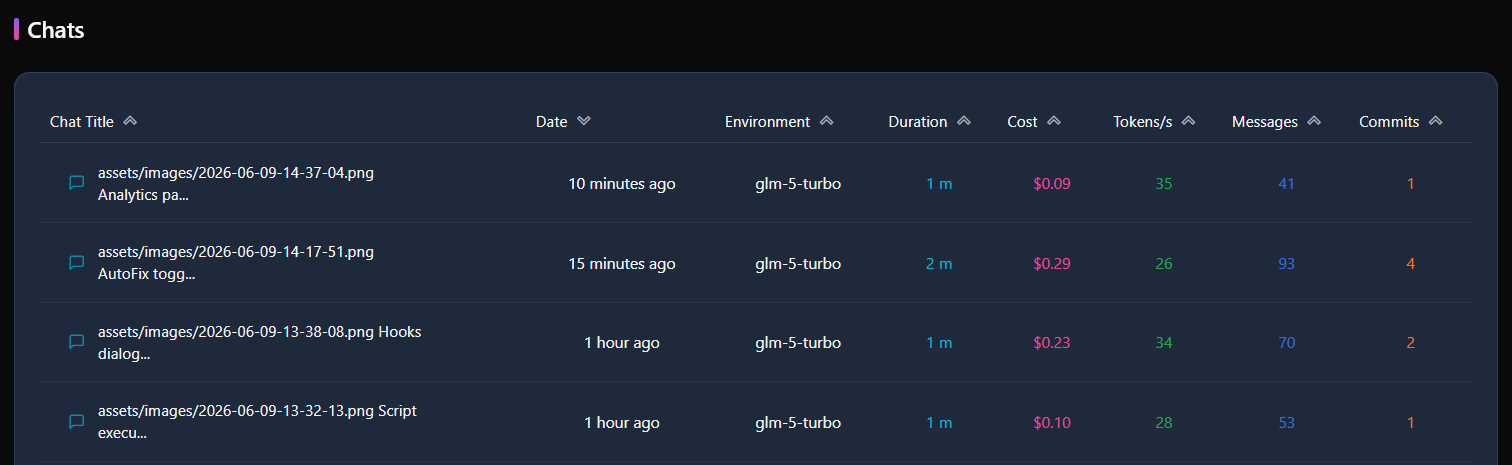
The table has ten columns, each sortable:
- Chat Title — the name of the conversation;
- Date — the time of the last activity (in relative form: “5 minutes ago” and the like);
- Model — the AI model used, and Skill — the skill attached to the chat;
- Duration — the total processing time;
- Tokens — the volume of text spent, and Cost — the spending for this chat;
- Tokens/s — the average response speed;
- Messages — the number of messages;
- Commits — how many times changes were saved to Git during the chat.
Clicking a column header sorts the table by that figure; clicking again flips the sort direction. The table is paginated — 10 chats per page.
Subagent chats
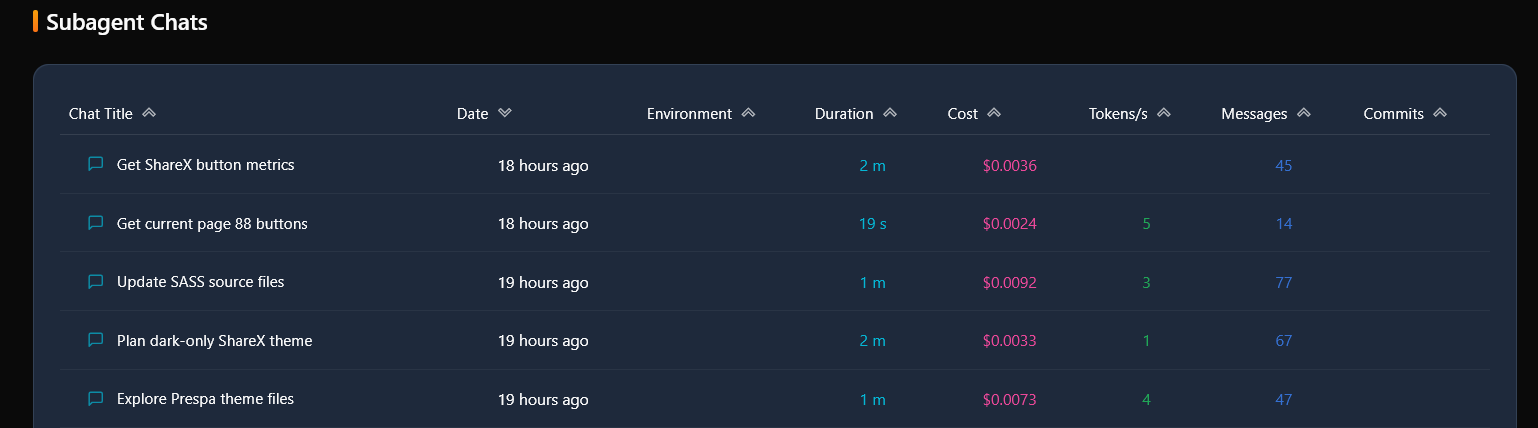
A separate table shows subagent chats — the “child” conversations the AI starts on its own to work on small tasks in parallel. They live in their own table so the difference is visible: whether you talked to the agent directly, or the agent worked by itself. Columns, sorting, and pagination are the same as in the main table.
Maintenance
At the bottom of the panel there are several service buttons:

- Recalculate Stats — recalculates tokens and cost from the raw chat data: it fixes possible losses, extracts missing numbers, and removes duplicates. Use it when the figures look stale or wrong. It runs in the background and, when finished, reports how many chats were fixed and how many duplicate tokens were removed;
- Reimport Subagent Chats — deletes all existing subagent chat data and loads it again from the local chat files. It asks for confirmation before running. The operation deletes data — use it only while the full history of the chats is still available on disk;
- Push to ClickHouse — when ClickHouse is configured (a system that collects statistics from all your projects), sends new and updated chat data for unified reporting across all instances. The button appears only when ClickHouse is configured.
Project code statistics
The Source Code Stats section of the analytics shows the makeup of your project’s code base: how many files and lines it consists of and which languages it is written in. It opens from the settings: the Tools group → the Analytics card → the Source Code Stats section of the analytics dialog.
At the top — five summary tiles for the whole project:
- Total Line Count — code, comments, and blank lines together;
- Code Lines — executable lines;
- Comment Lines — comment lines;
- Blank Lines — separators and spacing;
- Files — how many files were counted.
Below is a table by language: Language, Code, Comment, Blank, Files. In every column the width of the gradient bar is proportional to the leading language: the maximum fills the whole scale, the rest are shorter. Languages are sorted by lines of code, descending.
The numbers are counted by the external tool cloc, which is wired in automatically: the cloc installed on the system is used, and if there is none, a standalone script is downloaded into a temporary folder (it only needs Perl, no administrator rights). To keep the numbers an honest measure of the code base, only files tracked by Git are counted — build artifacts and dependencies never make it into the statistics. For projects outside Git, the count runs without repository awareness, excluding the usual service directories (node_modules, bin, obj, dist, build, target, vendor, .git).
The result is cached for 5 minutes, and computations run one at a time — so the panel never overloads the machine. The Refresh button next to the table title forces a recount on the spot; the cloc version and the counting time are shown next to it.