Analytics and observability provide the macro-level validation: are your AI sessions efficient, cost-effective, and productive? While individual message inspection validates correctness and build validation catches code errors, analytics validates your overall workflow quality by revealing patterns in token usage, cost, response speed, and commit activity across all your sessions.
Per-Message Metrics
Every message in the chat view carries detailed usage metadata. Hover over any message to see its stats, or look at the page header for aggregate totals:
- Processing time — How long the model spent generating that output
- Input tokens — Prompt tokens sent to the model for that turn
- Output tokens — Completion tokens the model generated
- Cache read tokens — Tokens served from prompt cache (faster and cheaper than fresh input)
- Cost — Calculated cost based on the environment’s pricing model (input, output, and cache token rates)
These per-message metrics help you spot problematic patterns in real-time. An unusually high input token count suggests the context is growing too large. A very long processing time with high output tokens may indicate the model is generating unnecessary content.
Analytics Dashboard
The Analytics page provides a comprehensive dashboard with 24 chart components organized into collapsible sections:
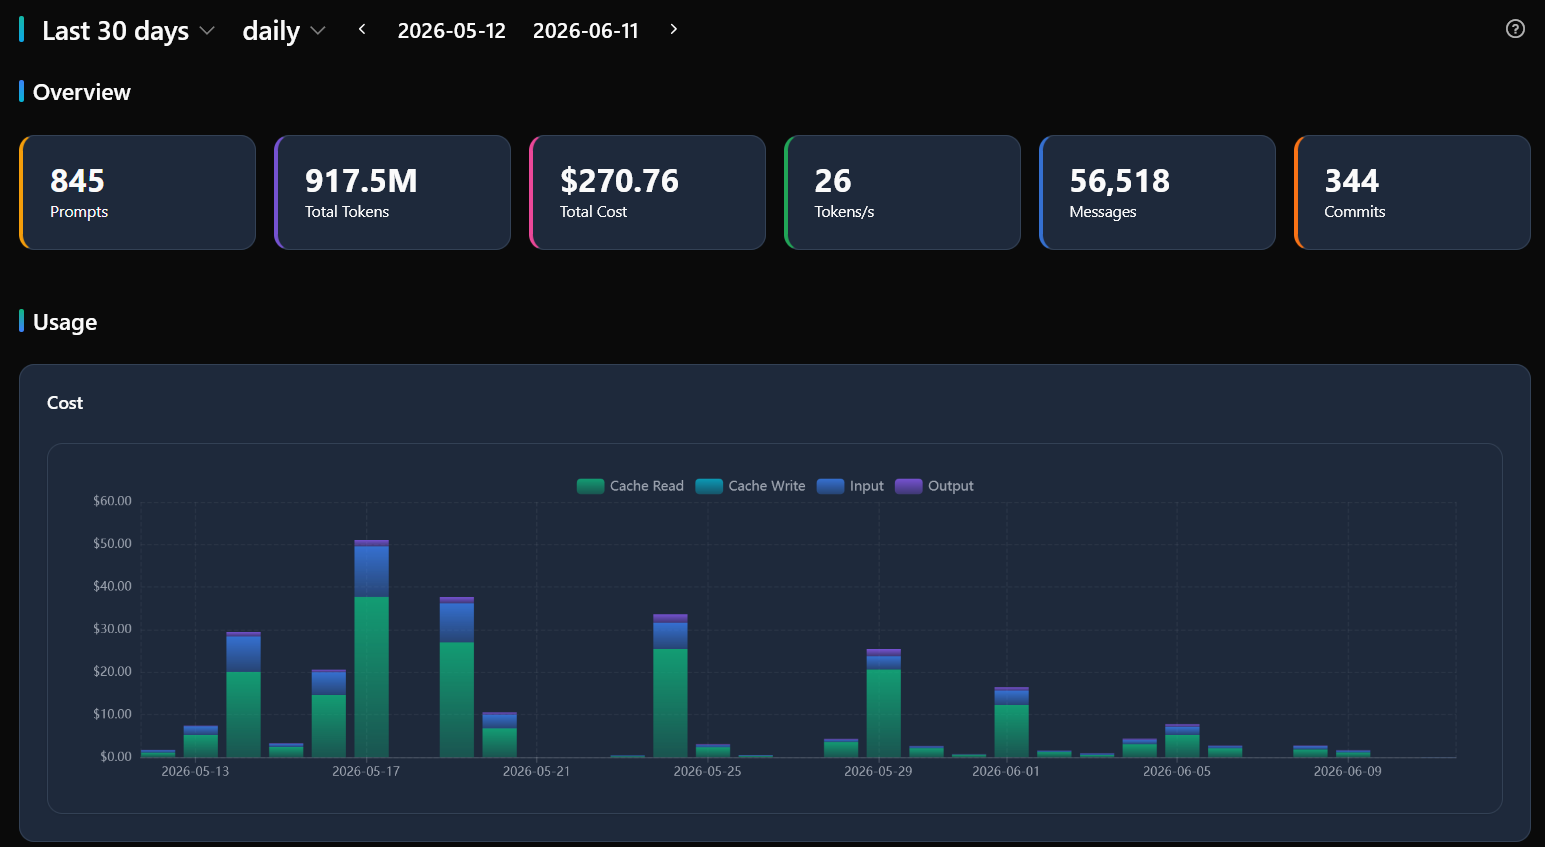
Overview Cards
Summary metric cards at the top show key numbers for the selected time period: total projects, sessions, prompts, messages, tools used, total cost, output tokens, input tokens, cache read/write tokens, processing time, and commits. These update dynamically when you change the date range.
Usage Charts
- Cost breakdown — Doughnut chart showing cost distribution across categories
- Tokens by granularity — Stacked area chart showing input, output, cache read, and cache write tokens over time
- Messages by granularity — Total message count over time at the selected granularity level
- Tokens per second — AI response speed chart, useful for comparing performance
- Hourly cost — Cost breakdown by hour of day, revealing peak expense times
- Hourly prompts — How many prompts you send at each hour, showing your usage patterns
- Hourly commits — When commits happen relative to your activity cycle
Pattern Analysis
- Tokens by hour of day — Identify when you consume the most tokens
- Messages by hour of day — See when you’re most active
- Tokens by day of week — Weekly usage patterns
- Messages by day of week — Which days are most productive
Distributions
- Tokens distribution — How token usage is spread across sessions
- Messages distribution — How message counts vary between sessions
- Cost distribution — How costs are distributed across chats
- Duration distribution — How processing times vary
Environment Comparisons
- Environment cost — Compare spending across different AI models/providers
- Environment tokens — Compare token consumption per environment
- Environment speed — Compare response speed across environments, useful for choosing the most cost-effective model
Date Range and Granularity
All charts respond to the date range selector at the top of the dashboard:
- Presets — Quick-select common ranges: today, last 7 days, last 30 days, last 90 days
- Custom range — Pick specific start and end dates
Four granularity levels control the data resolution:
- Hourly — One data point per hour, best for short ranges (today, yesterday)
- Daily — One data point per day, the default for most views
- Weekly — Aggregated weekly totals, best for month-to-quarter ranges
- Monthly — Aggregated monthly totals, best for long-term trend analysis
The dashboard automatically substitutes hourly granularity with daily when the selected range exceeds 31 days, preventing overwhelming charts.
Chat Table
Below the charts, a sortable table lists all chat sessions within the selected range. Each row shows the chat title, environment, total cost, token counts, processing time, prompt count, message count, and commit count. Click any column header to sort by that metric. The table supports pagination for large result sets.
The table includes both regular chats and sub-agent chats (from prompt-based builds), linked by their parentChatId. This lets you trace the full chain from a user conversation through any validation sub-agents it triggered.
ClickHouse Integration
For multi-project observability, Xedant Code can push analytics data to a ClickHouse database. Data is collected from every chat session and includes both main chat metrics and sub-agent metrics (input tokens, output tokens, cache tokens, cost, processing time, message count, commits) — 30 fields per row.
- Storage — Data is partitioned monthly by
toYYYYMM(updated_at)and ordered by project name, timestamp, and chat ID - Batch processing — Data is pushed in configurable batch sizes with retry logic for reliability
- Configuration — Set
XEDANT_CODE_CLICKHOUSE_URLto enable. The “Push to ClickHouse” button on the analytics page also triggers a manual push
ClickHouse integration enables building Grafana dashboards or custom reports across all your projects, rather than viewing each project’s analytics in isolation.
Effective Validation Patterns
- Watch cache hit rates — High cache read tokens relative to input tokens means efficient context reuse. Low cache hits suggest lots of new context is being processed each turn
- Compare environment costs — The environment cost chart reveals if cheaper models deliver acceptable results for routine tasks. Switch to the less expensive option when quality is comparable
- Track AutoFix cycles — Rising cost per chat after enabling AutoFix may indicate the model is stuck in fix loops. Check the chat table for sessions with unusually high message counts
- Monitor response speed — Tokens per second varies by environment. If a model is consistently slow, consider switching to a faster alternative for that type of task
- Use commit correlation — The hourly commits chart shows when your productive output peaks. Align your most important tasks with your highest-output hours
For the complete analytics feature reference, see Analytics. For per-message monitoring during sessions, see Chat Output Validation. For context management, see Context Utilization.