The analytics dashboard tracks your usage patterns over time — prompts sent, tokens consumed, costs incurred, AI response speed, and more. All data is displayed in interactive charts that you can filter by date range and granularity level.
What Does Analytics Track?
Analytics automatically collects data from your chat sessions. You don’t need to enable or configure anything — it starts tracking from your first message. The dashboard covers:
- Prompts — Number of user prompts sent
- Messages — Total messages (both user and assistant) exchanged
- Token usage — Tokens consumed, broken down into input, output, cache write, and cache read tokens
- Costs — Estimated spending based on your AI provider’s pricing
- Response speed — AI response speed measured in tokens per second
- Commit activity — Git commits made through the interface
- Environment data — Cost, token usage, and speed broken down by AI model/environment
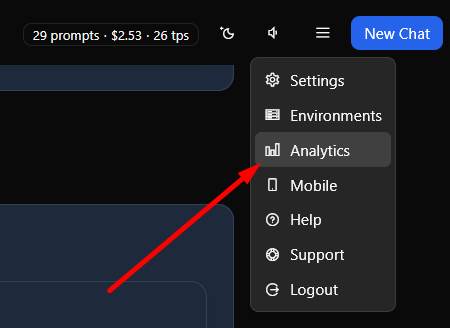
Opening Analytics
Navigate to Analytics from the main menu. The analytics dashboard opens with a date range selector at the top, summary metric cards below it, and detailed charts organized into collapsible sections.
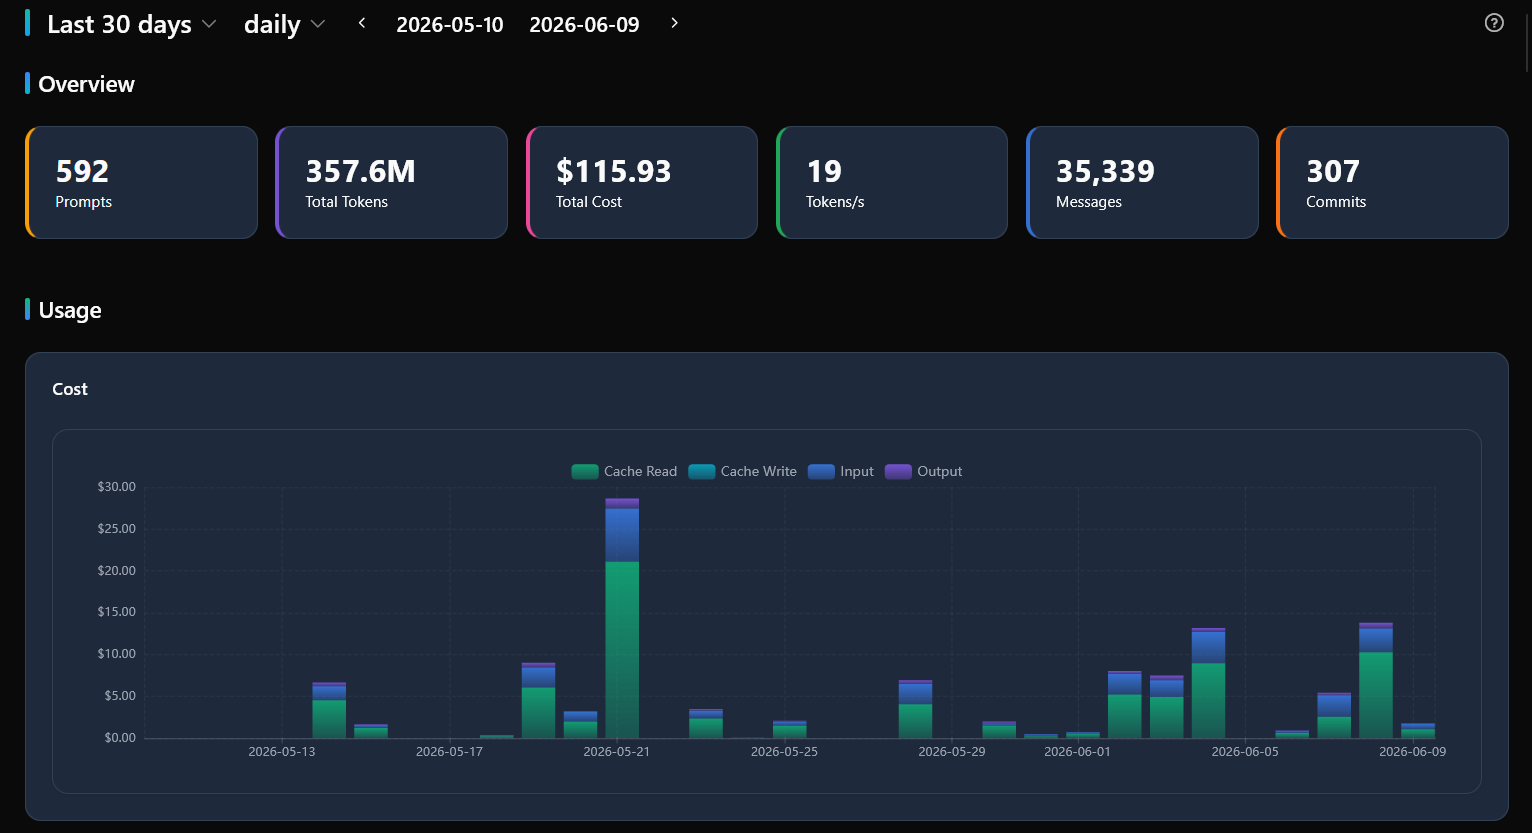
Dashboard Overview
The top of the dashboard shows summary metric cards — key numbers at a glance for the selected time period:

- Prompts — Total user prompts sent
- Total Tokens — Combined input, output, and cache tokens consumed
- Total Cost — Estimated spending across all chats
- Tokens/s — Average AI response speed in tokens per second
- Messages — Total messages exchanged
- Commits — Git commits made
These cards update based on the date range you select, so you can quickly compare metrics across different periods.
Chart Sections
Below the summary cards, the dashboard contains multiple chart sections. Each section is collapsible — click its header to expand or collapse it. The section state is persisted in localStorage so it remembers your preference between visits.
Usage
The largest section, containing time-series charts for cost, prompts, and commits:
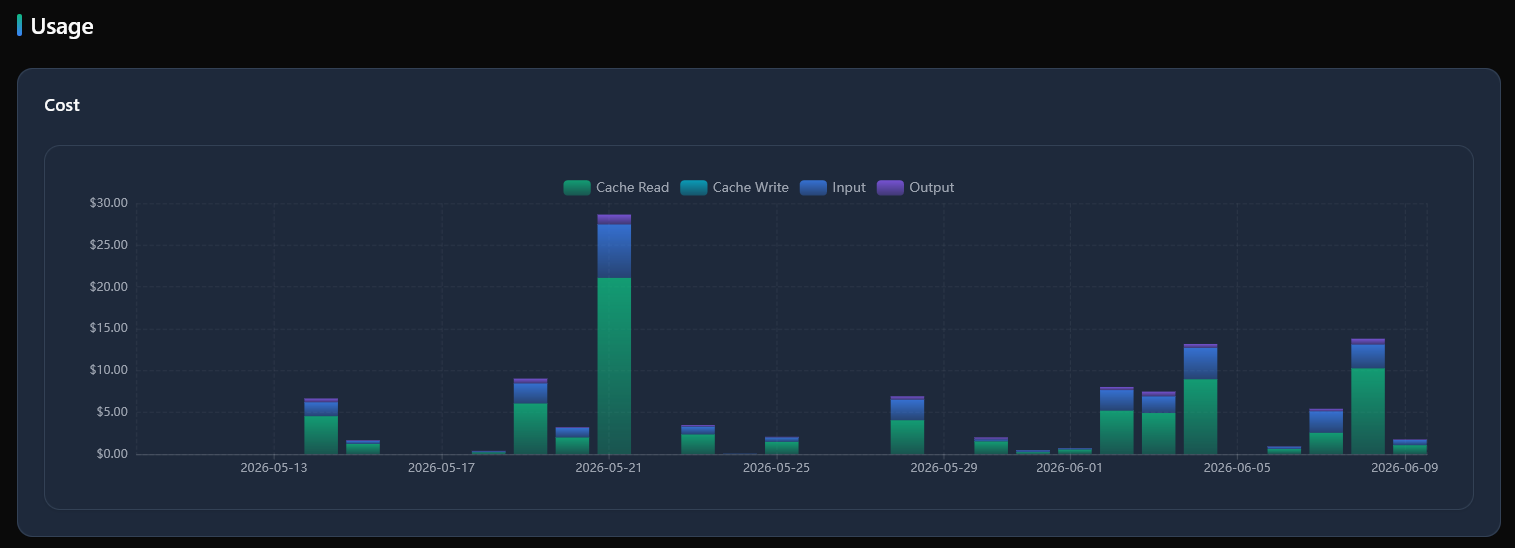
- Cost — Total cost over time, broken down by input, output, cache write, and cache read costs
- Environment Cost — Cost split by AI model/environment
- Prompts — Prompt count over time, including message and chat counts per period
- Commits — Git commit activity over time
Tokens
A collapsible subsection within Usage, showing token consumption and speed charts:
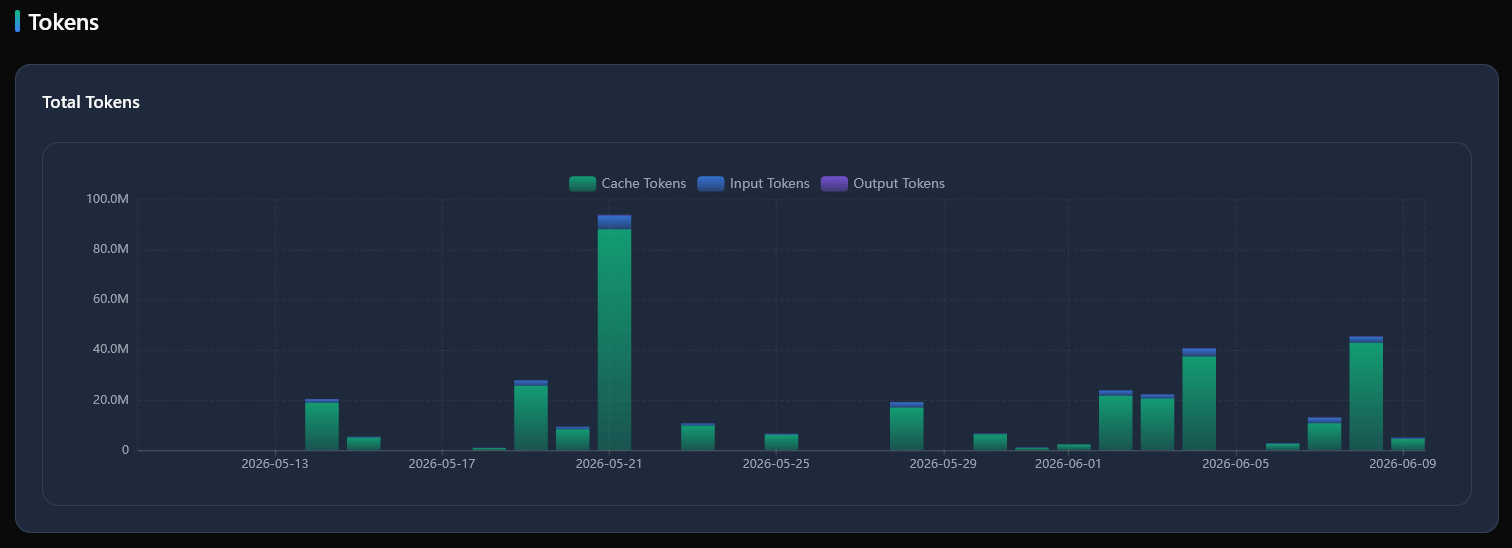
- Total Tokens — Token consumption over time, stacked by input, output, and cache tokens
- Tokens/s — AI response speed (tokens per second) over time
- Environment Tokens — Token usage split by AI model/environment
- Environment Speed — Response speed comparison across environments
Messages
A collapsible subsection within Usage, showing message count and throughput charts:
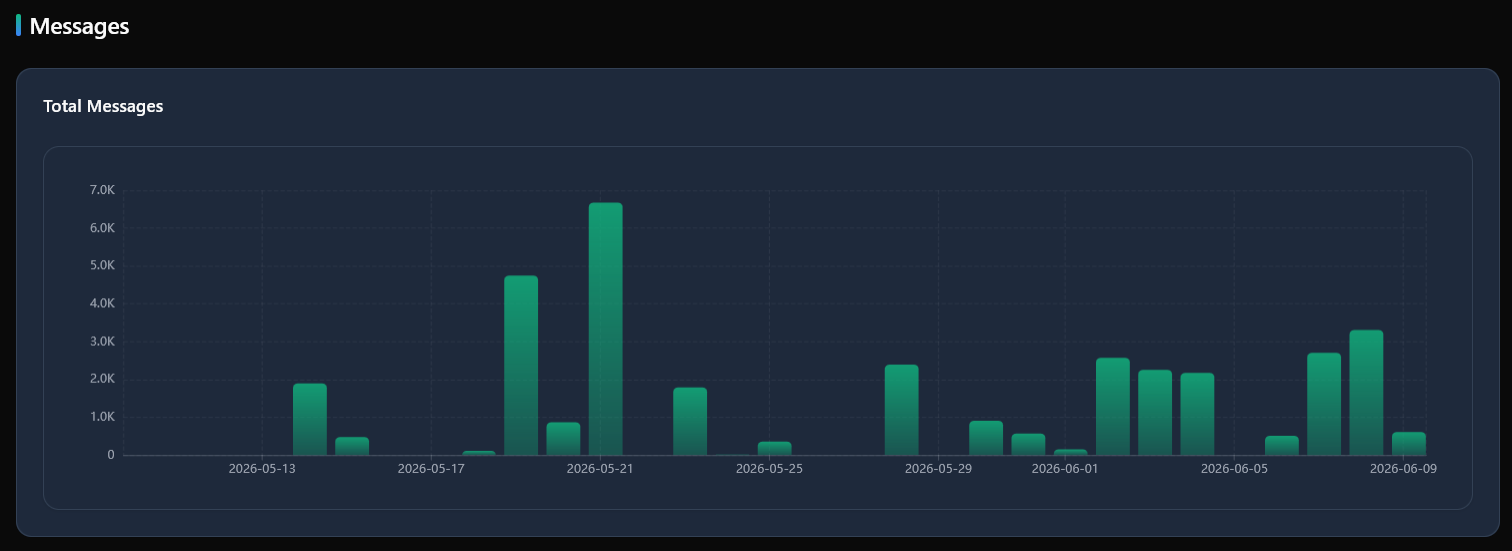
- Total Messages — Message count over time
- Messages/s — Message throughput over time
Hour of Day
Charts aggregated by hour of the day (0–23), displayed in your local timezone. Helps identify peak usage hours:
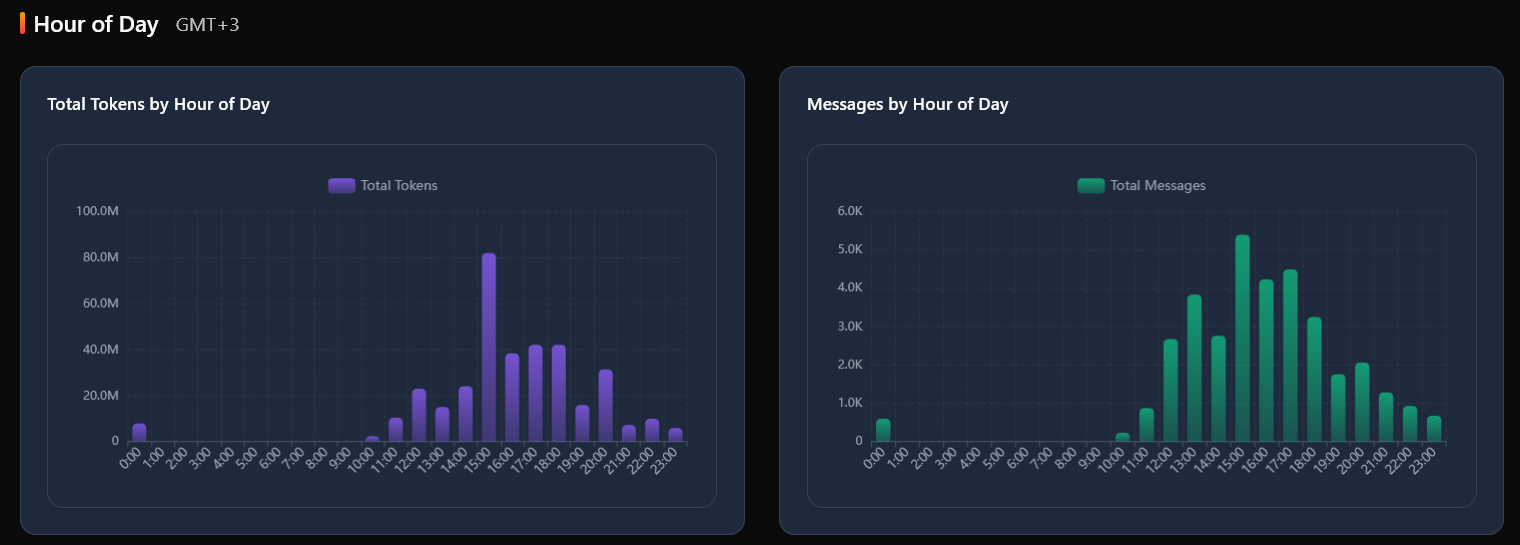
- Total Tokens by Hour of Day — Cumulative token volume per hour
- Messages by Hour of Day — Cumulative message volume per hour
- Tokens/s by Hour of Day — Average response speed per hour
- Messages/s by Hour of Day — Average message throughput per hour
Day of Week
Charts aggregated by day of the week, showing which days are most active:
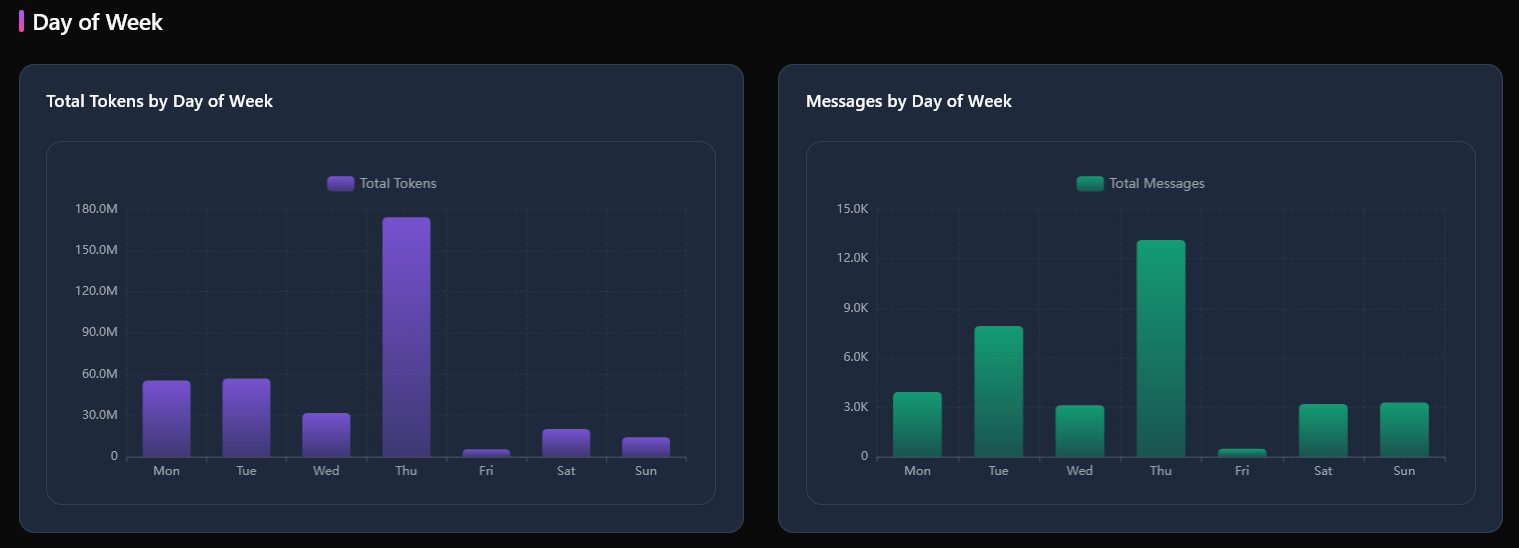
- Total Tokens by Day of Week — Cumulative token volume per day
- Messages by Day of Week — Cumulative message volume per day
- Tokens/s by Day of Week — Average response speed per day
- Messages/s by Day of Week — Average message throughput per day
Distributions
Per-chat distribution charts showing how metrics vary across individual sessions:
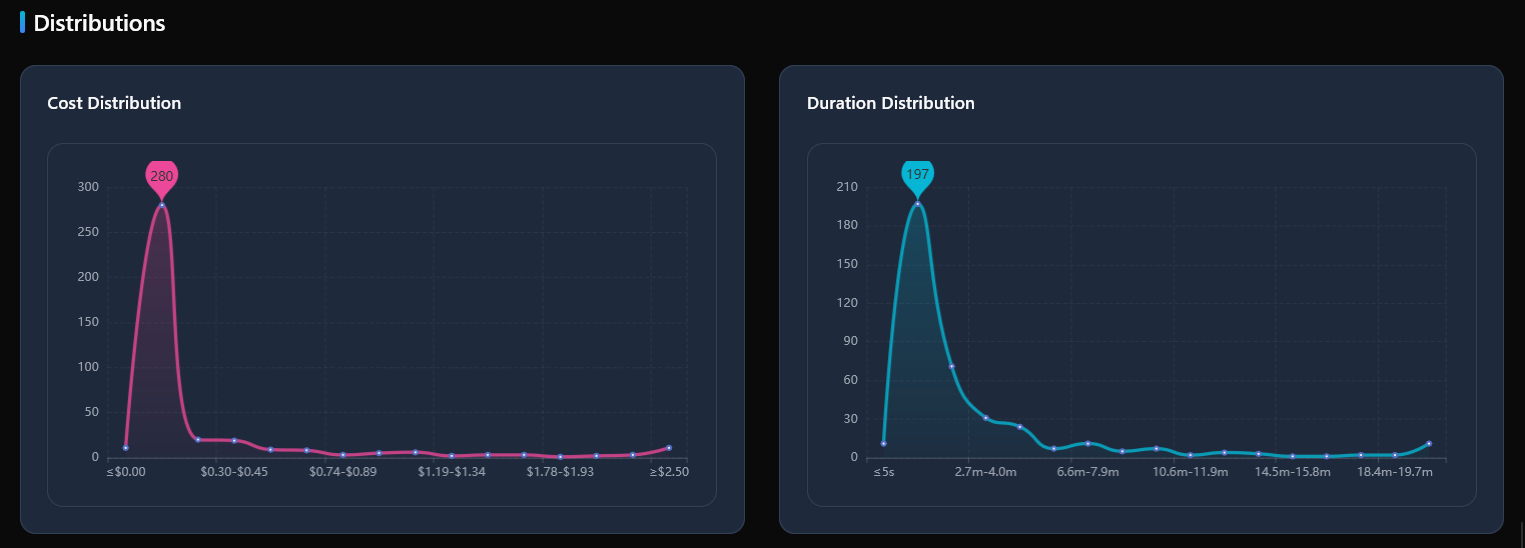
- Cost Distribution — How cost is distributed across chats
- Duration Distribution — How long chats last (processing time)
- Tokens/s Distribution — Response speed distribution across chats
- Messages/s Distribution — Message throughput distribution across chats
Charts are interactive — hover over data points to see detailed values. The charts update in real-time when you change the date range or granularity.
Date Range Selection
Use the date range selector at the top of the dashboard to filter all data by time period:

- Presets — Quick-select common ranges: today, last 7 days, last 14 days, last 30 days, last 90 days, etc.
- Custom range — Pick specific start and end dates for a custom time window
- All Time — Selects from your very first chat to today
All summary cards and charts update to reflect the selected date range. This makes it easy to compare your usage across weeks, months, or specific time periods.
Usage Granularity
Toggle between different levels of detail to view data at the scale that makes sense for your date range:
- Hourly — One data point per hour. Automatically falls back to daily for ranges over 30 days
- Daily — One data point per day. The default for most views and ideal for week-to-month ranges
- Weekly — Aggregated weekly totals. Best for month-to-quarter ranges
- Monthly — Aggregated monthly totals. Best for long-term trend analysis
Your granularity preference is saved in localStorage and persists between visits.
Chat Table
Below the charts, a table shows per-chat statistics. Click any row to open that chat. Hold Ctrl+Click to open in a new tab.
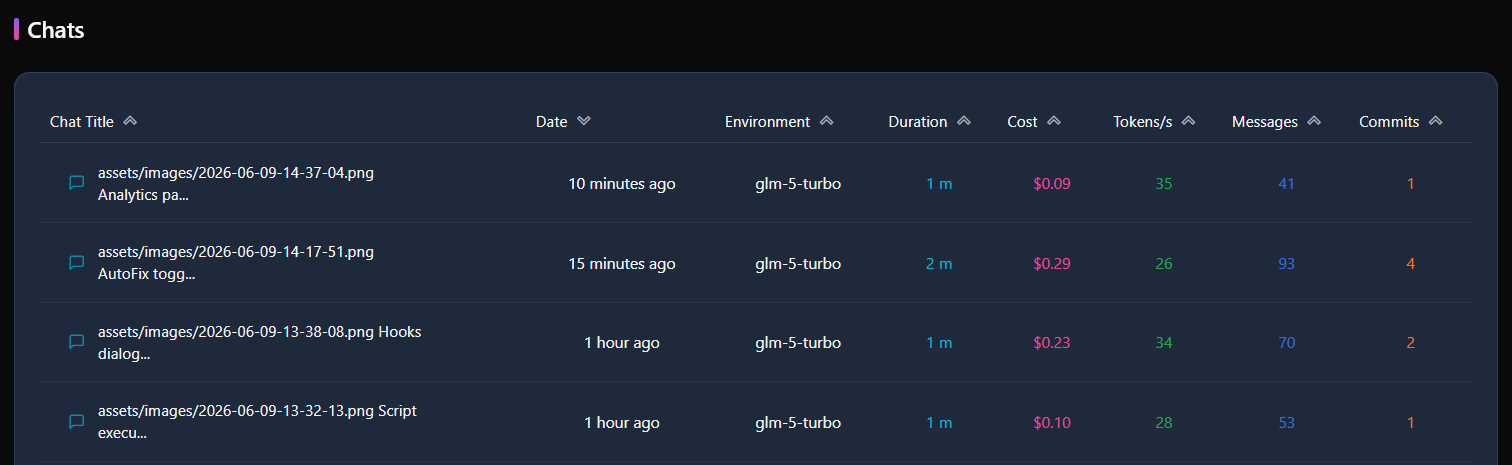
The table has eight sortable columns:
- Chat Title — Name of the chat session
- Date — Last updated time (relative format)
- Environment — AI model/environment used
- Duration — Total processing time
- Cost — Total cost for that chat
- Tokens/s — Average response speed
- Messages — Message count
- Commits — Git commits made during the chat
Click any column header to sort by that metric. Click again to reverse the sort order. The table is paginated at 10 chats per page.
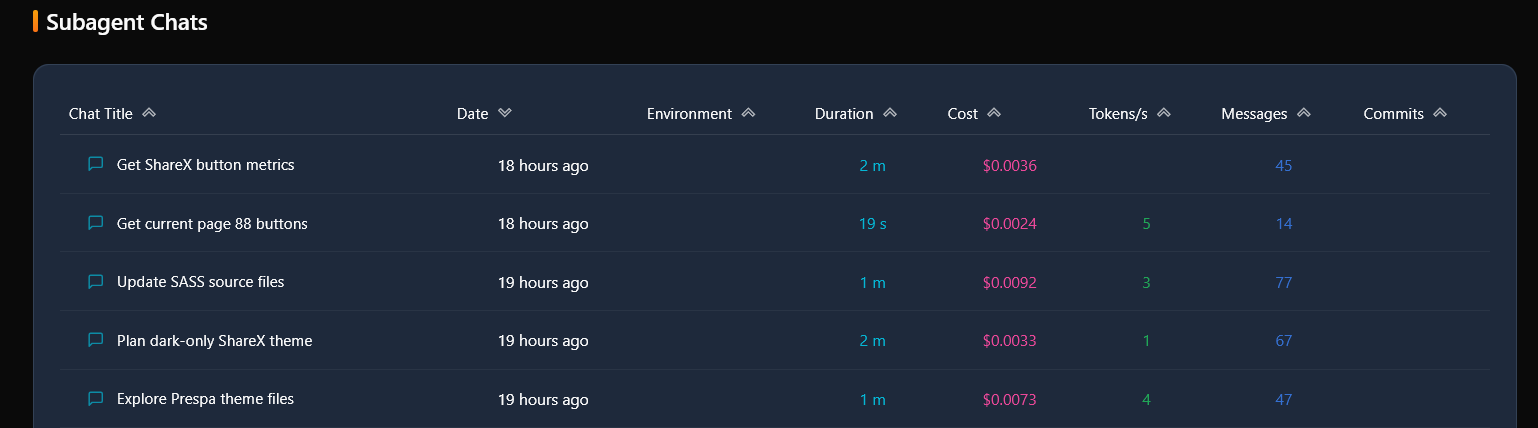
Subagent Chats
A separate table shows subagent chats — child conversations spawned by the AI (e.g. Claude Code agents). These are separated from the main chat table so you can distinguish between your direct conversations and agent-initiated ones. The subagent table has the same columns, sorting, and pagination as the main chat table.
Advanced Operations
The analytics dashboard includes a few advanced options at the bottom of the page:

- Recalculate Stats — Recalculates tokens and costs from raw chat data, fixes orphaned output messages, extracts tokens from raw JSON, and deduplicates messages. Use this if displayed metrics seem outdated or incorrect. Runs in the background and shows the number of chats fixed and duplicate tokens removed when complete
- Reimport Subagent Chats — Deletes all existing subagent chat data and reimports from Claude Code chat files on the local disk. Shows a confirmation dialog before proceeding. This is a destructive operation — only use it if the full history of chat files is still available locally
- Push to ClickHouse — If ClickHouse is configured, incrementally pushes new and updated chat data for centralized reporting across multiple instances. This button only appears when ClickHouse is set up